
Research, made readable
Why there’s no single normal birthweight for puppies
A number on the scale needs a little company: the breed, the litter, the puppy’s age—and a clear idea of what you’re comparing.
Explore the breed data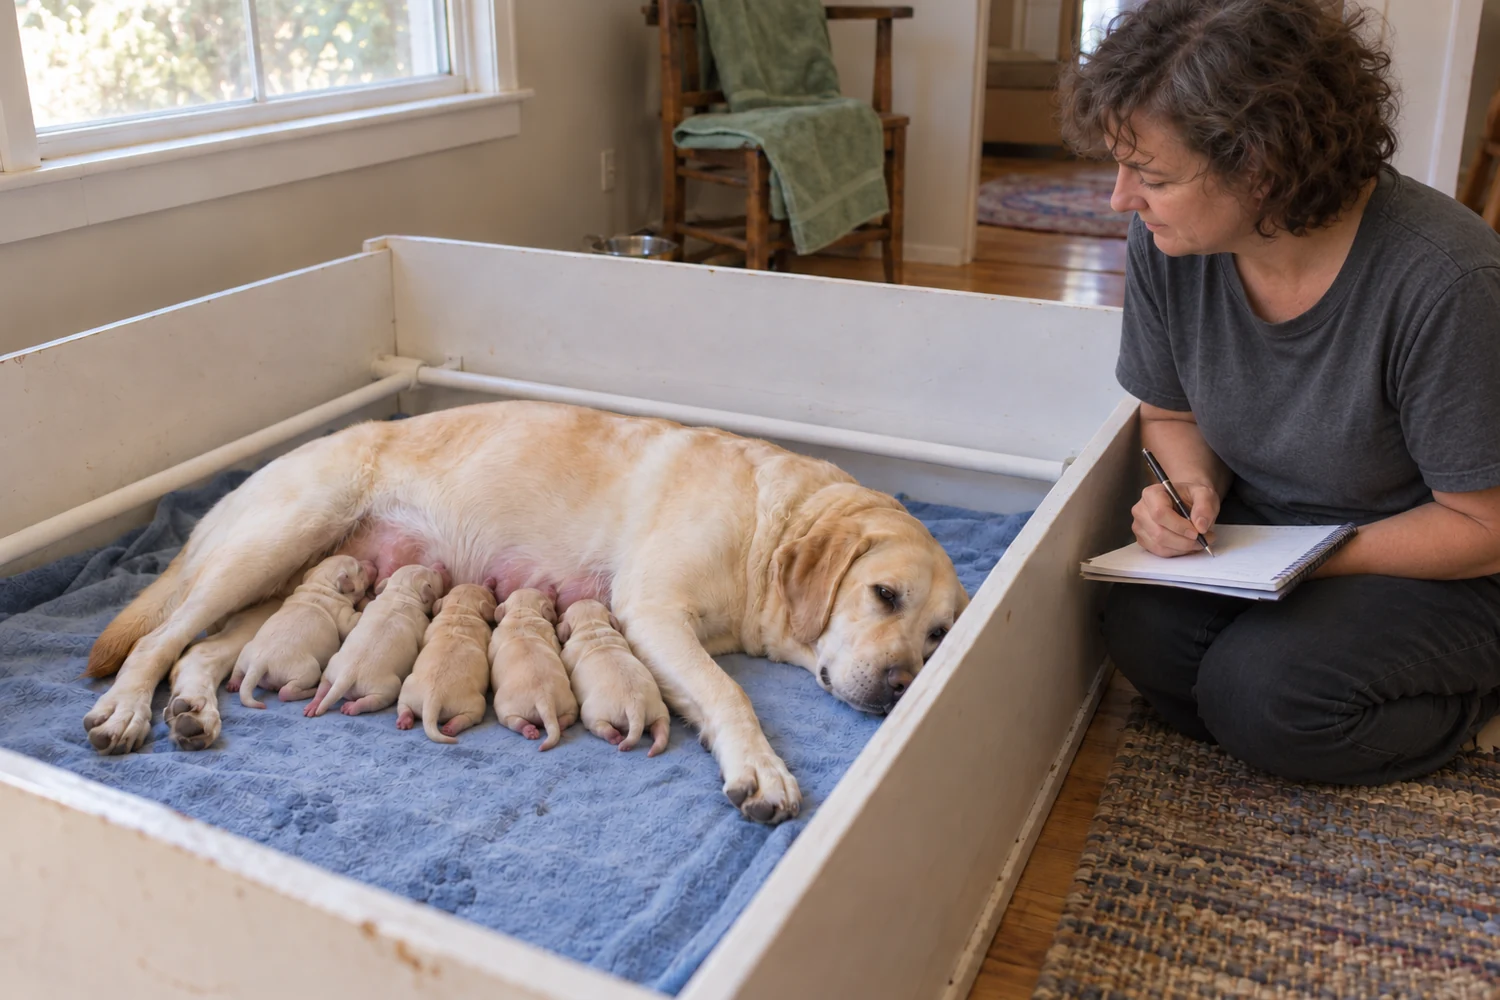
If you’ve ever searched for a “normal puppy birthweight,” you’ve probably found a very tidy answer to a rather untidy question.
Dogs arrive in very different sizes. A useful comparison needs to say which puppies it describes. And even a carefully measured weight can’t, by itself, tell you whether an individual newborn is doing well.
This is a closer look at what published birthweight data can tell you—and what the numbers leave for your veterinarian to assess.
Start with the population
One species. Very different starting weights.
In a French study of 6,694 live-born puppies, breed medians ranged from 118 g for Chihuahuas to 640 g for Newfoundlands. Those are the middle values in the recorded groups, not suggested birthweights. Mugnier et al., 2019 ↗
Where birthweights fell in 27 breeds
Dot = median · Band = Q1 to Q3, the middle half of recorded weights
Other size groups Breeds classified as giant in this study

Read all 27 breeds as a data table
| Breed | Puppies (n) | Q1 (g) | Median (g) | Q3 (g) |
|---|---|---|---|---|
| Chihuahua | 157 | 102 | 118 | 133 |
| Yorkshire Terrier | 128 | 120 | 140 | 164.25 |
| Pomeranian | 117 | 130 | 150 | 166 |
| Maltese | 178 | 140.5 | 165 | 187 |
| Shih Tzu | 225 | 158 | 172 | 190 |
| Bichon Frise | 107 | 162 | 183 | 212.5 |
| Dachshund | 152 | 163.75 | 184 | 203.5 |
| Coton de Tulear | 159 | 165 | 190 | 210 |
| Lhasa Apso | 153 | 165 | 190 | 216 |
| West Highland White Terrier | 164 | 176.75 | 200 | 224.25 |
| Jack Russell Terrier | 122 | 185 | 205.5 | 225 |
| Cavalier King Charles Spaniel | 155 | 202 | 230 | 250 |
| French Bulldog | 111 | 210 | 240 | 266 |
| Cocker Spaniel | 477 | 223 | 270 | 310 |
| Beagle | 124 | 280 | 310 | 342.7 |
| English Bulldog | 123 | 262 | 310 | 370 |
| Australian Shepherd | 420 | 315 | 365.5 | 410 |
| Golden Retriever | 483 | 350 | 400 | 438.5 |
| Labrador Retriever | 1846 | 363.2 | 410 | 460 |
| Rottweiler | 111 | 370 | 410 | 447.5 |
| Boxer | 123 | 415 | 470 | 520 |
| White Swiss Shepherd | 114 | 420 | 472.5 | 520 |
| Bernese Mountain dog | 265 | 445 | 480 | 555 |
| German Shepherd | 197 | 436 | 500 | 570 |
| Leonberger | 216 | 450 | 520 | 581.25 |
| Alaskan Malamute | 104 | 500 | 580 | 631 |
| Newfoundland | 163 | 570 | 640 | 688 |

Look a little closer
“Giant breed” still isn’t a birthweight.
Adult-size labels are broad buckets. In this study’s giant group, the Rottweiler median was 410 g; the Newfoundland median was 640 g. The bands below also overlap. Sharing a category doesn’t make the distributions identical. Tables 1 & 2 ↗
You can use a breed label to ask a better question. You can’t use it to finish the assessment.
Four breeds, one adult-size group
Same zero-based scale. Labels mark Q1, median and Q3.

Read the four-breed data table
| Breed | Puppies (n) | Q1 (g) | Median (g) | Q3 (g) |
|---|---|---|---|---|
| Rottweiler | 111 | 370 | 410 | 447.5 |
| Bernese Mountain dog | 265 | 445 | 480 | 555 |
| Leonberger | 216 | 450 | 520 | 581.25 |
| Newfoundland | 163 | 570 | 640 | 688 |
A small reading skill, a big difference
The middle half isn’t the healthy half.
A median puts the ordered observations in the middle: half lie at or below it and half at or above it. The first and third quartiles—Q1 and Q3—mark the edges of the middle half. Together they describe a distribution. They don’t sort puppies into “fine” and “needs help.”
That distinction is easy to lose when a table gets passed around without its methods. Calling an interquartile band a “normal range” changes its meaning. It also hides the observations on either side.
Keep this beside a research chart
Three things a birthweight chart can mean
- Median
- Where the middle observation sits. It isn’t a target for every puppy.
- Interquartile range
- Q1 to Q3: the middle half of this sample. It isn’t the smallest-to-largest span.
- Clinical assessment
- A different question: how is this puppy doing? A chart of quartiles can’t answer it.
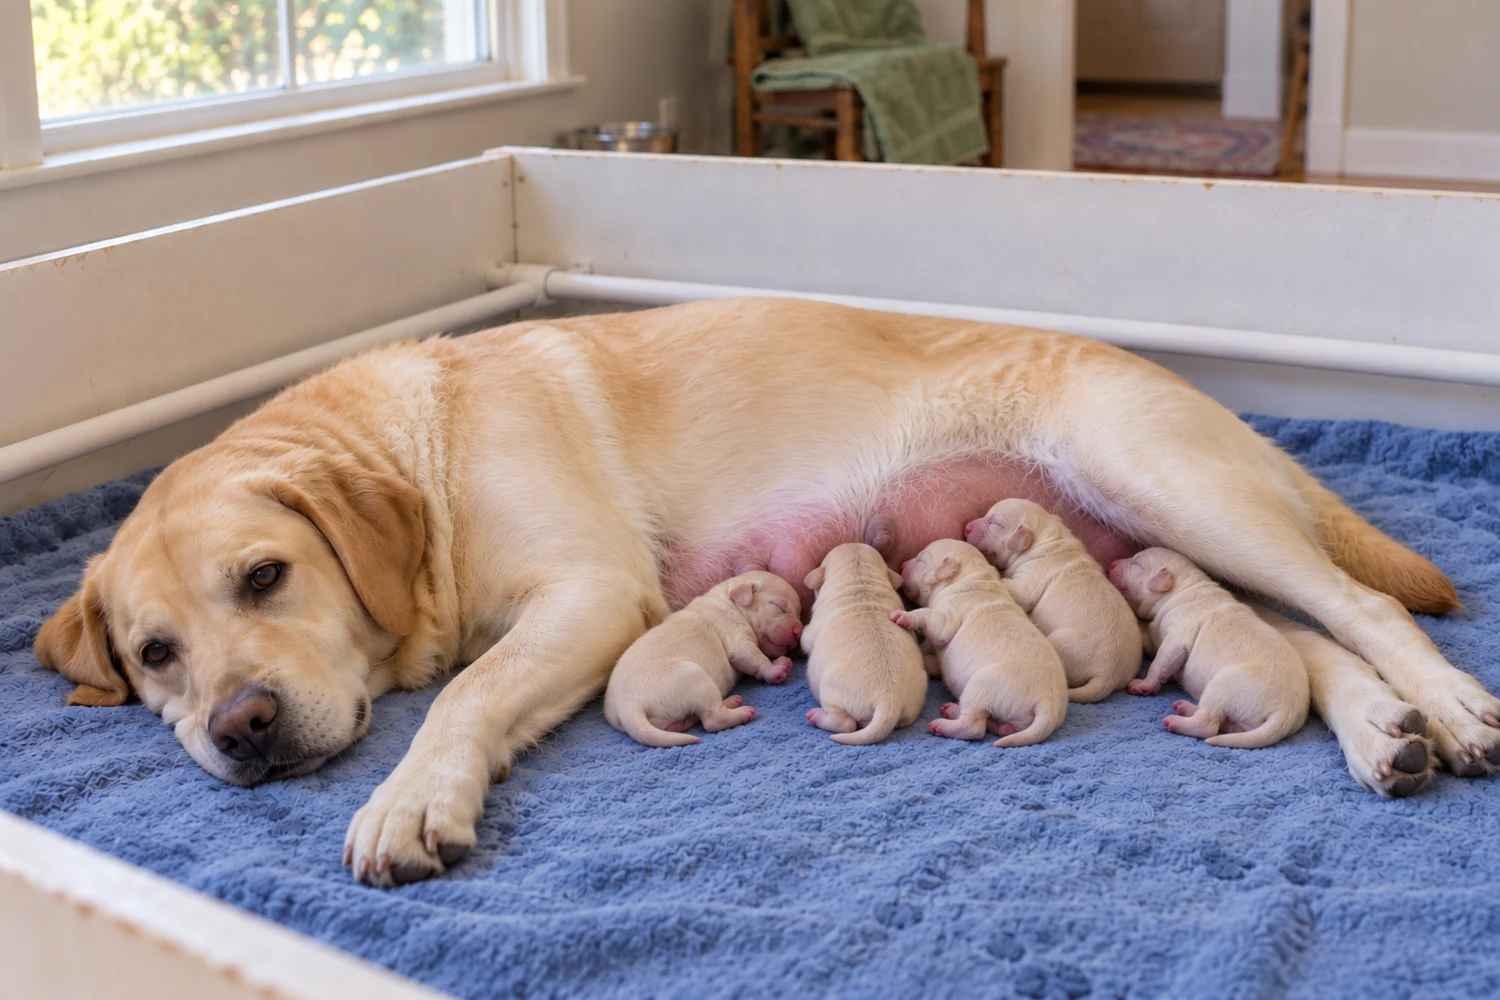
Put the evidence to work
Bring a better question, not a verdict.
Breed is part of the explanation, not the whole explanation. An Italian census of 3,293 puppies examined maternal size, body weight and body shape as well as litter size and sex. Birthweight was associated with several maternal characteristics. That doesn’t tell you why one particular puppy is small. Groppetti et al., 2017 ↗
Later French research followed both birthweight and growth during the first week. It used five separate growth intervals and survival to two months; its growth analyses didn’t all contain the same number of puppies. A starting weight and a later change are different observations. Keep the dates and age interval attached when you discuss them. Mugnier et al., 2023 ↗
When you talk to your veterinarian, bring the actual weight, unit, observation time, puppy identity and subsequent readings, along with what you’ve noticed about the puppy and mother. Ask which comparisons are appropriate for this litter and how the weight fits the wider assessment. If you’re concerned about a newborn, contact your veterinarian rather than waiting for a chart to settle the question.

Follow the evidence
Sources & a little more depth
The figures are original plots of published summaries. No individual observations have been reconstructed from the quartiles.
- Mugnier et al. · 2019
Birth weight as a risk factor for neonatal mortality: Breed-specific approach to identify at-risk puppies. Preventive Veterinary Medicine 171, 104746. Table 1 supplies the plotted weights; Table 2 supplies size groups. Methods §§2.1–2.2 and Results §3.1 describe the population. Mortality was followed to Day 21; the quartile bands shown here are descriptive. - Groppetti et al. · 2017
A National Census of Birth Weight in Purebred Dogs in Italy. Animals 7, 43. Italian voluntary census, 99 breeds; useful context for maternal differences. Institutional abstract and indexed Methods consulted; no values from its tables are plotted here. - Mugnier et al. · 2023
Relative Impact of Birth Weight and Early Growth on Neonatal Mortality in Puppies. Animals 13(12), 1928. Methods §§2.1–2.3; Table 1. 8,550 puppies, 24 breeds, 127 French kennels. Voluntary records and variable available growth data limit generalization. - Read further · Chastant, 2026
Developmental programming in dogs. Biology of Reproduction 115, 379–387. A narrative review of early-life influences and remaining research questions; it does not validate these quartiles as clinical boundaries.