
Breeding & research / Lifespan & evidence
What dog lifespan studies can tell breeders
A breed’s lifespan estimate can start a useful conversation. First, check what the number means—and which dogs it describes.
Keep a question sheet ↓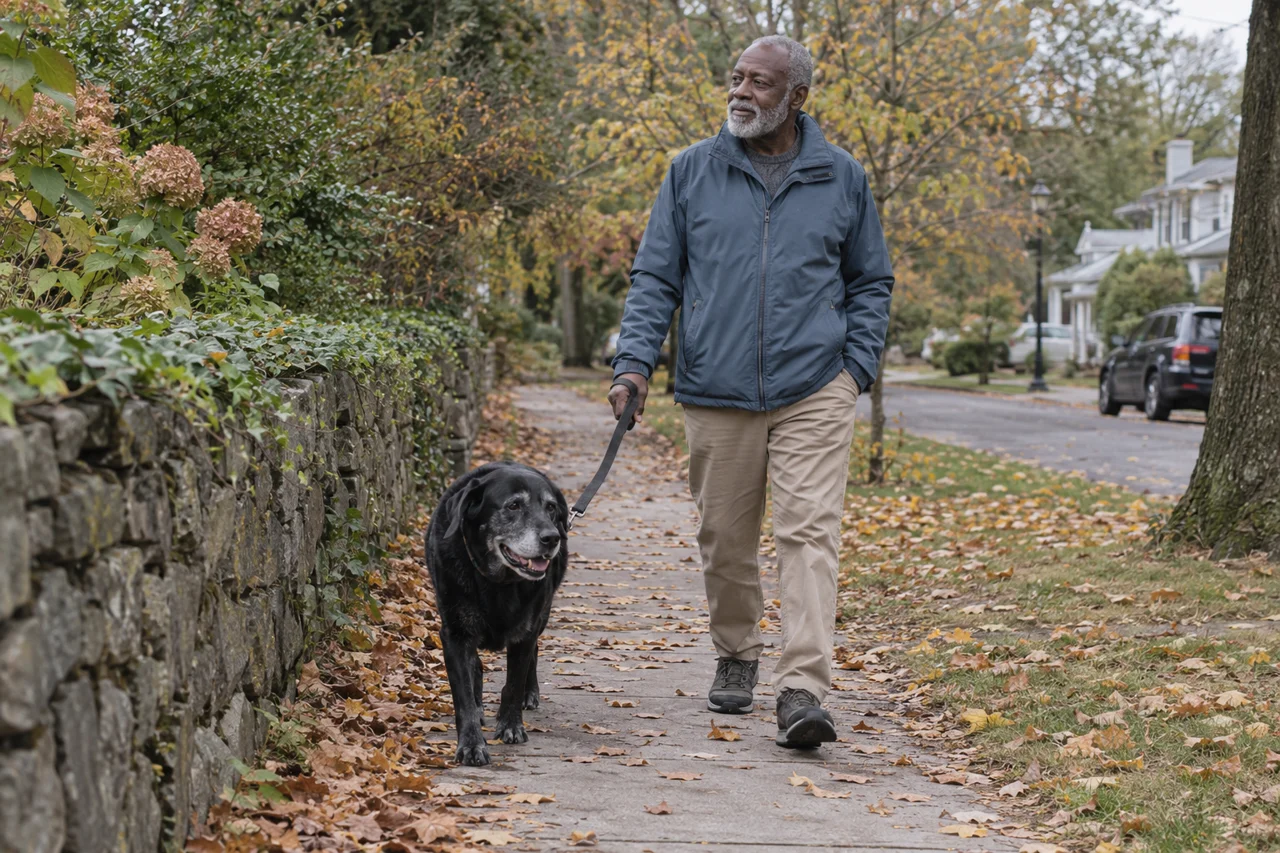
A family asks how long a puppy is likely to live. It’s a fair question, and it deserves more than either a firm promise or a shrug. Published studies can describe patterns in groups of dogs. They cannot assign this puppy a date.
The most useful answer keeps three things together: the measure, the population and the uncertainty. Once you know those, you can explain a finding without making it do more work than it can.
Look closer
Find out what “lifespan” means.
Before comparing breed rankings, read the label beside the years. A mean, a median and an estimate of remaining life are different summaries. Two careful papers can report different numbers without either being wrong.
Keep this distinction
Three lifespan numbers, three questions
| Measure | What it tells you | What to check |
|---|---|---|
| Mean age at death | Arithmetic average of recorded ages at death. | Which deaths were recorded and over what period? |
| Median survival | Age where estimated survival reaches 50%. | Which dogs entered the survival analysis, including living dogs? |
| Remaining life expectancy | Expected additional years conditional on reaching a given age. | At what age, in which life table and population? |
Original reference comparison informed by Teng et al. (2022), life tables (Introduction; Table 1) and McMillan et al. (2024), longevity (Survival analysis).
This matters especially with an adult dog. An estimate from birth includes deaths at young ages that the dog has already outlived. Look for a result conditional on the age already reached, rather than subtracting that age from a headline average.
Look closer
Use the estimate for the age already reached.
From the published data
Reaching an age changes the question.

Original selected-point redraw: Teng et al. (2022), life tables, Table 2, PDF p4. UK primary-care records; 30,563 confirmed deaths during 2016–July 2020 among dogs under care in 2016. CC BY 4.0; layout changed, seven ages selected. No individual prognosis.
Read the data and method notes
| Age | Expected remaining years (95% CI) | Life-table lₓ / deaths in next year |
|---|---|---|
| 0 | 11.23 (11.19–11.27) | 30,563 / 514 |
| 2 | 9.58 (9.54–9.61) | 29,568 / 482 |
| 5 | 7.02 (6.98–7.05) | 28,038 / 677 |
| 8 | 4.61 (4.58–4.64) | 25,215 / 1,730 |
| 10 | 3.28 (3.25–3.31) | 21,220 / 2,852 |
| 12 | 2.23 (2.2–2.25) | 14,919 / 3,645 |
| 14 | 1.46 (1.43–1.48) | 7,489 / 3,126 |
lₓ is the number surviving to age x in the constructed life table, derived from the recorded deceased dogs. It is not a fresh prospective enrollment count at each age. The article plots selected published ages without interpolating a survival curve. Intervals are published bootstrap confidence intervals, not ranges for individual lifespans.
Download chart data (CSV)The small confidence intervals describe precision around group estimates under the study’s method. They don’t mean that almost every dog lives within those narrow limits. A dog’s health history is much richer than a row in a life table.
Notice the scope, too: these are all-dog UK primary-care results. A photograph of a Labrador beside the article does not turn the plotted values into Labrador-specific estimates.
Look closer
Ask which dogs could enter the records.
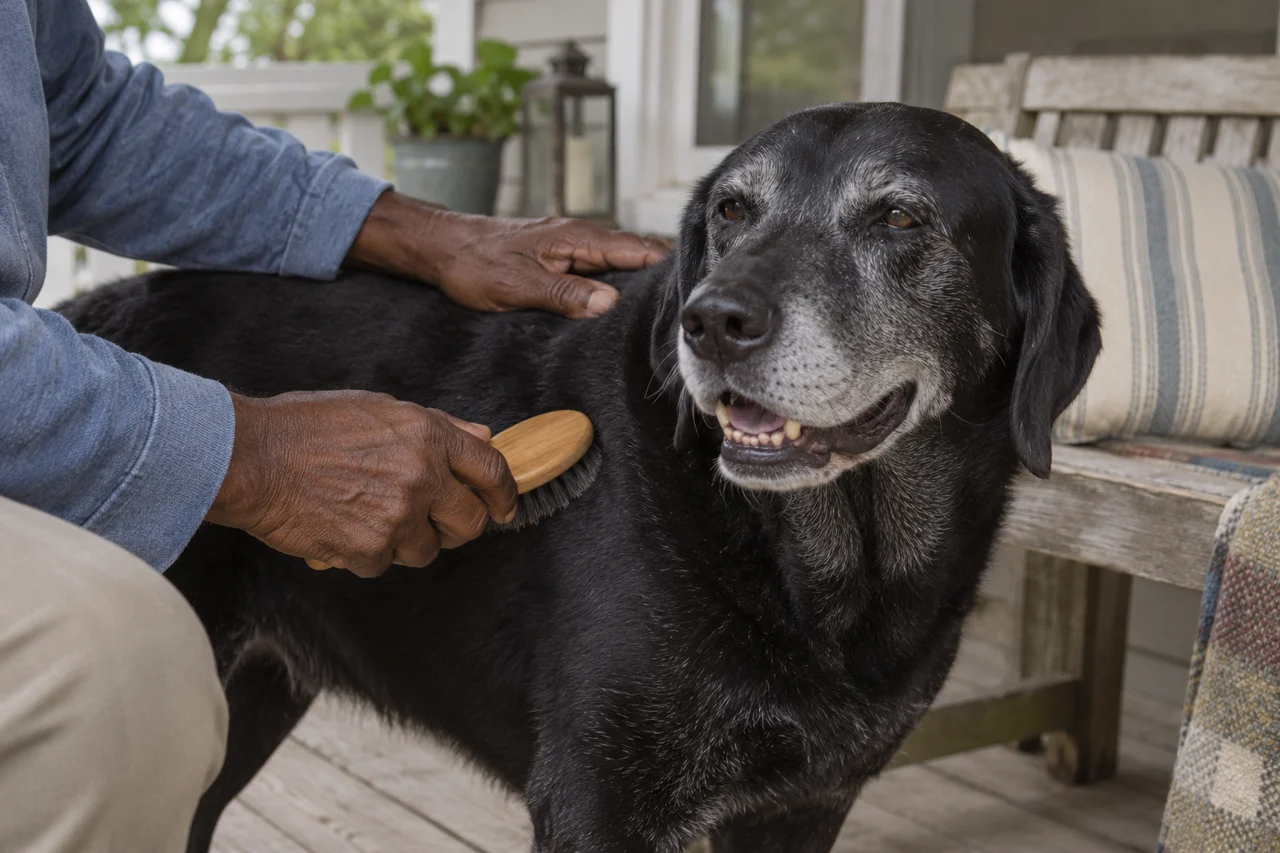
Veterinary records, insurance records and owner surveys each show a different view of dog life. Who uses the service, which deaths are recorded and how ages are confirmed can affect the result. Country and calendar years belong beside the estimate.
McMillan and colleagues pooled UK records from 18 organizations in their 2024 study. They estimated survival in a dataset containing both deceased and living dogs. That differs from Teng’s construction using confirmed deaths. Read the data sources and analysis.
Use that difference to ask better questions, rather than combining the two papers into a before-and-after trend. A later publication year alone cannot establish that a breed’s lifespan has changed.
Look closer
Give families context they can use.
A useful explanation might be: “This study gives a group estimate for dogs in a particular setting. Individual dogs vary, and we also need to talk about the health concerns relevant to this breed and family.” You can show the original source and explain its measure in one sentence.
Years alone don’t tell you about comfort, mobility, behavior or the burden of illness. Keep those questions in the conversation. A lifespan ranking is not a complete ranking of welfare, and an observational association is not proof that a particular mating will add years.
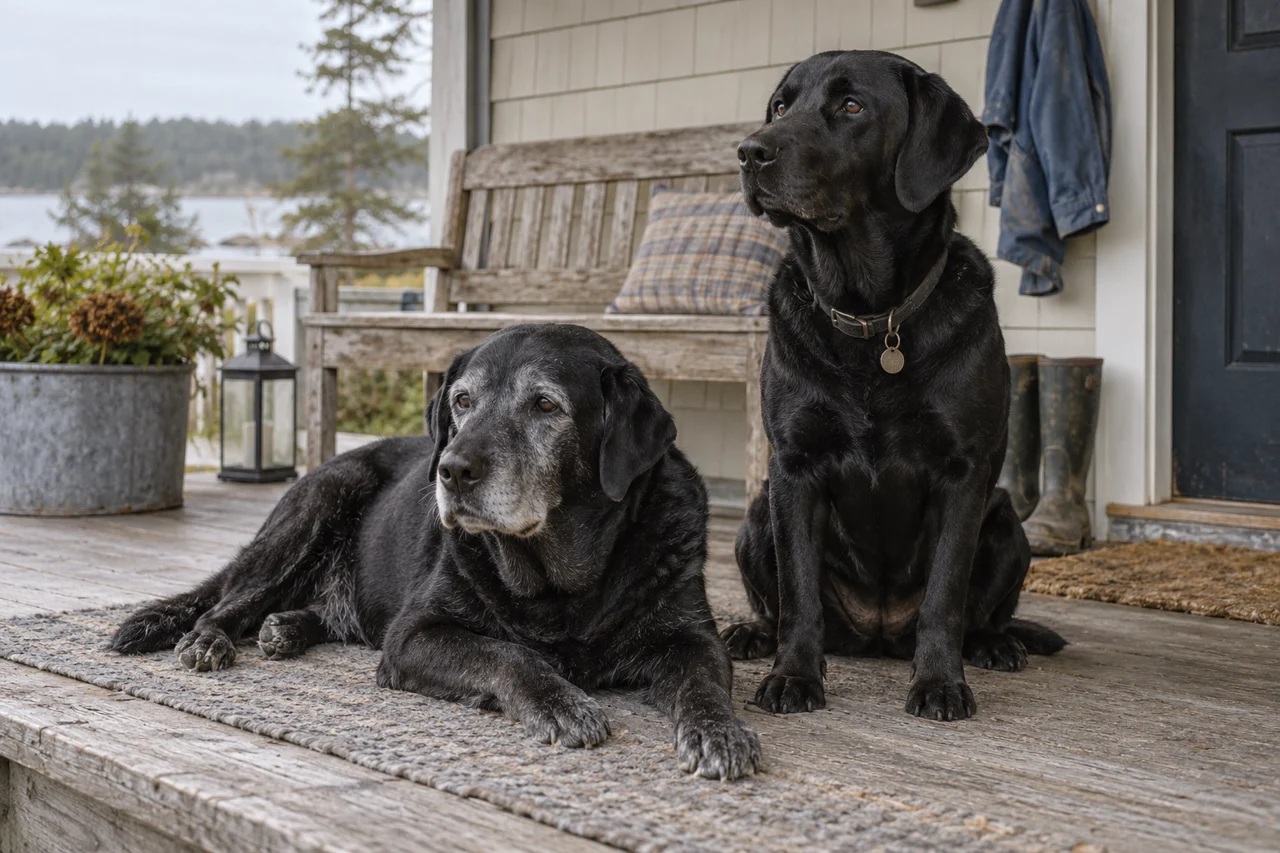
When you evaluate your own lines, preserve dates, diagnoses and the source of each report. A few long-lived relatives are valuable history, but they are not a controlled comparison or a reliable guarantee for a puppy. Your veterinarian can help distinguish a family history question from a prognosis for a dog already in your care.
Keep the useful part
Prepare a lifespan conversation.
Keep the finding you want to discuss and the limits that matter to that discussion. Notes stay in this tab. Export them before closing to keep a copy.
Original blank reading aid. No information is sent to an account. This sheet records questions; it does not calculate breeding suitability.
Follow the evidence
Read the original sources.
- Teng et al. (2022), life tables
- McMillan et al. (2024), longevity
- McMillan et al., April 2024 correction
Finished reading?
Keep track of the guides you’ve explored.