
Breeding & research / Genetic diversity / Methods
Why dog inbreeding numbers may not match
A pedigree result and a DNA result can describe different parts of the same history. Find the method before comparing the figures.
Keep a question sheet ↓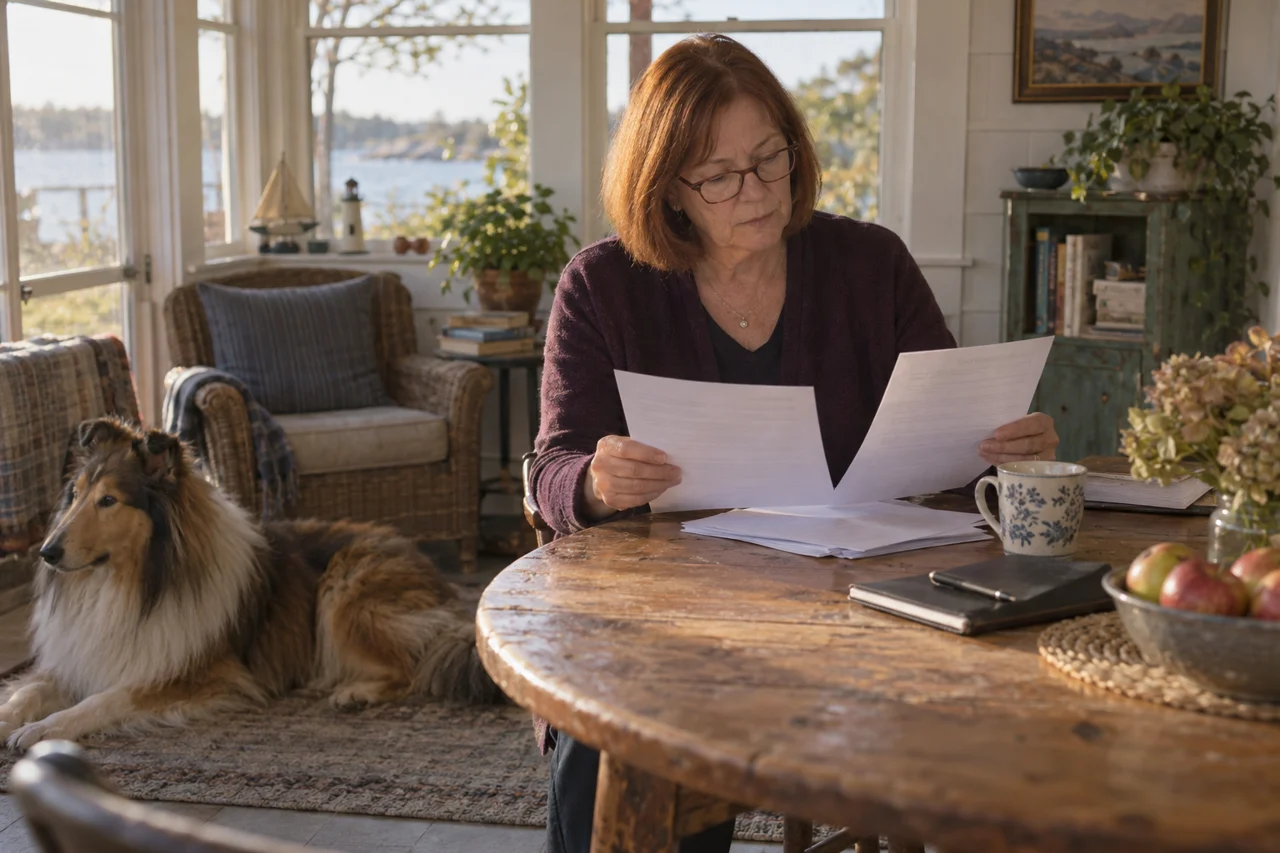
One report gives a pedigree coefficient. Another gives a DNA estimate. The numbers differ, and suddenly the conversation is about which one must be wrong. Start a little earlier: are they measuring the same thing?
Often, they aren’t. Pedigree depth, DNA coverage, the algorithm and the reference population can change what a number means. You can investigate the difference without forcing one result into the other’s scale.
Look closer
Name the ancestry the pedigree can see.
A pedigree coefficient of inbreeding estimates the probability that two copies at a locus trace to the same ancestral copy, using recorded ancestry. A five-generation calculation only uses the ancestry included in that calculation. It cannot reveal every shared ancestor earlier in the breed’s history.
The Nordic Kennel Union Scientific Committee guidance explains that limited-generation estimates can be useful for identifying recent relatedness while missing older accumulated inbreeding. An incomplete record also needs its own explanation. “No shared ancestor found” means little without knowing how far and how completely you looked.

Read the frame
A five-generation view has an edge.
An ancestor outside that frame does not become unrelated simply because the record stops.
Look closer
Ask how the DNA estimate was made.
Keep this distinction
Compare the method before the number.
| Report type | What sits behind it | What must travel with the result |
|---|---|---|
| Pedigree coefficient | Probability of two copies tracing to a common ancestor in the recorded pedigree. | Generation depth, completeness and treatment of founders. |
| Runs of homozygosity (ROH) | DNA segments where the two chromosome copies match across a run of markers. | Marker coverage, segment rules and the calculation’s denominator. |
| Marker-based internal relatedness | An allele-frequency-weighted measure at the tested markers. | Marker set and comparison-population allele frequencies. |
Original reference matrix: Nordic Kennel Union Scientific Committee: inbreeding estimates, pp1–2; UC Davis VGL: English Mastiff diversity report (2019), overview, PDF p1 (2019 report). VGL’s internal relatedness is one specified marker-based measure, not a synonym for genomic COI.
DNA-based methods examine the dog’s markers rather than reconstructing every transmission from a pedigree. Some use runs of homozygosity; others use marker frequencies. Algorithms and marker coverage affect the estimate. Ask the provider what its number measures and what comparison makes sense.
For example, VGL’s published English Mastiff diversity report describes 33 autosomal STR markers alongside DLA haplotype information. Its internal-relatedness calculation considers marker heterozygosity and allele frequencies. That result should not be relabeled as a pedigree coefficient or treated as interchangeable with an ROH estimate. Read the 2019 report’s overview, PDF p1.
The useful comparison is between clearly defined measures under compatible methods. There is no justified universal conversion that turns any DNA result into a five-generation pedigree coefficient.
Look closer
Resolve a mismatch in a useful order.
First, confirm both reports refer to the same dog. Then compare the method names, versions, generation depth or marker scope, and reference information. Ask whether each figure describes the individual dog or an estimate for offspring from a proposed pairing. Those are different questions.
Next, ask the provider whether it expects these results to be directly comparable. A change in the comparison population or calculation may alter a number even when the dog’s DNA has not changed. Keep earlier reports rather than silently replacing them with the newest figure.
Finally, write down what remains unresolved. If the methods differ, a disagreement in the numbers may be expected. If comparable methods give a surprising discrepancy, the laboratories can help investigate sample identity, data and calculation details.
Look closer
Keep the dog, the pairing and the breed distinct.
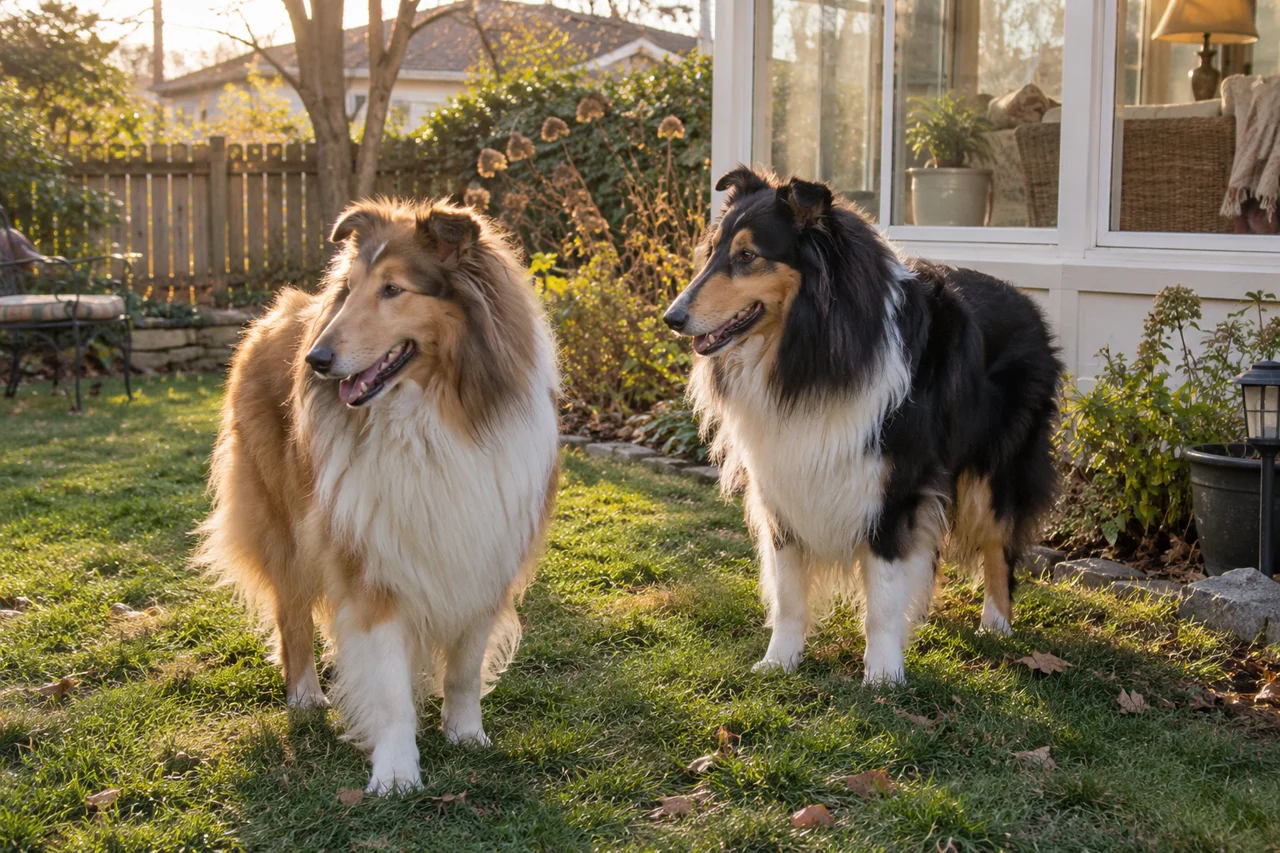
An individual’s coefficient describes that individual under a defined method. Planning a pairing also requires the relationship between the two dogs and the expected contribution to their offspring. A single number cannot capture health, temperament, fertility, relatedness and a breed’s longer-term options.
Historical pedigree research such as Lewis and colleagues’ UK breed study examines change across populations and time. It helps explain why the rate of inbreeding matters. It does not supply a universal DNA cutoff for every individual dog.
Use a comparison sheet to prepare a conversation with someone who understands the method and the breed. The useful outcome is a clearer interpretation and an explicit remaining question, rather than a red or green badge for a breeding dog.
Keep the useful part
Compare two inbreeding reports.
Put each result beside its definition. Leave a field unresolved if the provider has not supplied it. Notes stay in this tab. Export them before closing to keep a copy.
Original blank reading aid. No information is sent to an account. This sheet records questions; it does not calculate breeding suitability.
Follow the evidence
Read the original sources.
- Nordic Kennel Union Scientific Committee: inbreeding estimates
- UC Davis VGL: canine genetic diversity
- UC Davis VGL: English Mastiff diversity report (2019)
- Lewis et al. (2015), UK breed genetic diversity
Finished reading?
Keep track of the guides you’ve explored.